Indigenous Deaths in Custody: Chapter 2 Profile: Indigenous Deaths in Custody: Chapter 2 Profile: Indigenous Deaths in Custody
Indigenous Deaths in Custody
Part B - Statistical AnalysisChapter 2. Indigenous Deaths in Custody Chapter 2
|
||||||||||||||||||||||||||||||||||||||||||||||||||||||||||||||||||||||||||||||||||||||||||||||||||||||||||||||||||||||||||||||||||||||||||||||||||||||||||||||||||||||||||||||||||||||||||||||||||||||||||||||||||||||||||||||||||||||||||||||||||||||||||||||||||||||||||||||||||||||||||||||||||||||||||||||||||||||||||||||||||||||||||||||||||||||||||||||||||||||||||||||||||||||||||||||||||||||||||||||||||||||||||||||||||||||||||||||||||||||||||||||||||||||||||||||||||||||||||||||||||||||||||||||||||||||||||||||||||||||||||||||||||||||
| Table 2.1a Royal Commission | Table 2.1b Post-Royal Commission | ||||||
|
Deaths in Custody |
Deaths in Custody |
||||||
| Year |
Institutional Setting |
Police Pursuit |
Total |
Year |
Institutional Setting |
Police Pursuit |
Total |
| 1980 |
11 |
na |
11 |
1989b |
9 |
- |
9 |
| 1981 |
6 |
na |
6 |
1990 |
8 |
4 |
12 |
| 1982 |
8 |
na |
8 |
1991 |
12 |
1 |
13 |
| 1983 |
11 |
na |
11 |
1992 |
6 |
3 |
9 |
| 1984 |
6 |
na |
6 |
1993 |
9 |
1 |
10 |
| 1985 |
9 |
na |
9 |
1994 |
12 |
2 |
14 |
| 1986 |
9 |
na |
9 |
1995 |
17 |
5 |
22 |
| 1987 |
20 |
na |
20 |
1996c |
6 |
1 |
7 |
| 1988 |
14 |
na |
14 |
||||
| 1989a |
4 |
1 |
5 |
||||
| Total |
98 |
1 |
99 |
Total |
79 |
17 |
96 |
a = January to May 1989
b = June to December 1989
c = January to May 1996
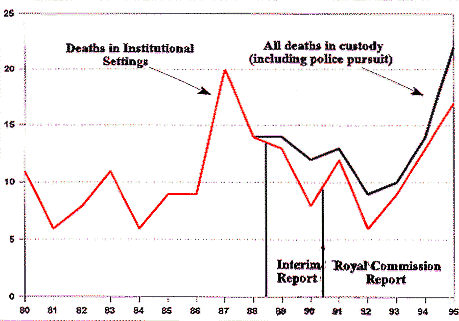
Figure 2.1 Aboriginal Deaths in Custody
2. Gender
Table 2.2 presents the deaths in the Royal Commission period and post Royal Commission period separately for males and females. In both periods the proportion of women was relatively small (RC=10, 7.5 per cent; post-RC=7, 9.5 per cent). No significant difference was found in the proportion of males and females in the Royal commission period and the post-Royal Commission period. 4
| Table 2.2 Gender | ||
| Gender |
RCIADIC |
Post-RCIADIC |
| Male |
88 |
70 |
| Female |
10 |
9 |
| Total |
98 |
79 |
3. Age
Table 2.3 presents the age distribution of Aboriginal people who died in custody in the two periods. The mean age of Aboriginal people who died in institutional settings in the Royal Commission period was 31.7 years. The mean age of people who died in institutional settings after the Royal Commission was 30.2 years. The difference in age is not significant. 5
Table 2.3 Age |
||||
|
Years |
RCIADIC |
Post-RCIADIC |
||
|
Institutional |
All |
Institutional |
All |
|
|
0-14 |
1 |
1 |
1 |
5 |
|
15-19 |
12 |
12 |
10 |
17 |
|
20-24 |
14 |
14 |
21 |
22 |
|
25-29 |
22 |
23 |
12 |
13 |
|
30-34 |
18 |
18 |
11 |
12 |
|
35-39 |
6 |
6 |
10 |
10 |
|
40-44 |
13 |
13 |
5 |
6 |
|
45-49 |
2 |
2 |
4 |
5 |
|
50-54 |
2 |
2 |
3 |
4 |
|
55-59 |
5 |
5 |
0 |
0 |
|
Over 60 |
3 |
3 |
2 |
2 |
|
Total |
98 |
99 |
79 |
96 |
|
Average |
31.3 |
31.7 |
30.2 |
30.0 |
|
Median |
29 |
29 |
28 |
27 |
4. Jurisdictions
Table 2.4 presents the number of people who died in custody in each jurisdiction in the Royal Commission period and the period after the Royal Commission. The difference in the location of deaths between the two periods is significant. 6 As table 2.4 demonstrates the largest percentage increases occurred in New South Wales (15.2 to 31.6) and Victoria (3.0 to 6.3). The percentage of deaths decreased in Western Australia (32.3 to 10.1) while Queensland remained relatively constant in both periods (27.3 to 29.1).
Table 2.4 Deaths in Custody by State and Territory |
|||||
| State |
RCIADIC |
Post-RCIADIC |
|||
|
Number |
% |
Number* |
% |
||
| NSW |
14 |
14.3% |
25 |
(29) |
31.6% |
| VIC |
3 |
3.1% |
5 |
(6) |
6.3% |
| QLD |
27 |
27.6% |
23 |
(25) |
29.1% |
| WA |
32 |
32.7% |
8 |
(15) |
10.1% |
| SA |
12 |
12.2% |
11 |
(12) |
13.9% |
| TAS |
3 |
3.1% |
1 |
(2) |
1.3% |
| NT |
9 |
9.2% |
6 |
(7) |
7.6% |
| Total | 98 |
100.0% |
79 |
(96) |
100.0% |
| *The numbers in brackets indicate totals for all deaths in custody (institutional settings and police pursuit). Percentages are based on deaths in institutional settings. The one death from police pursuit during the Royal Commission period occurred in New South Wales. | |||||
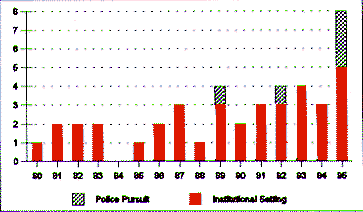
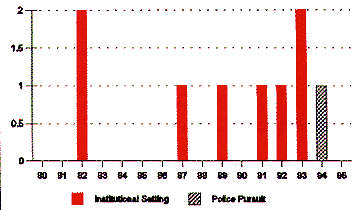
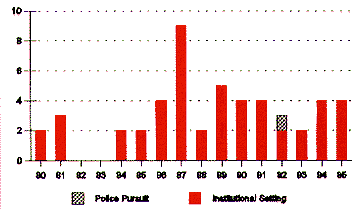
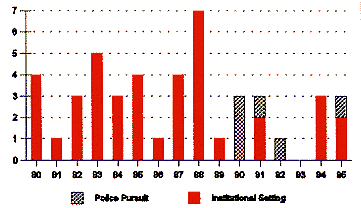
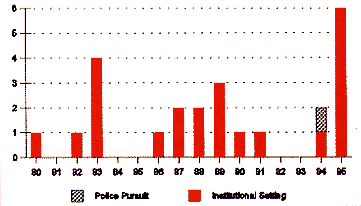
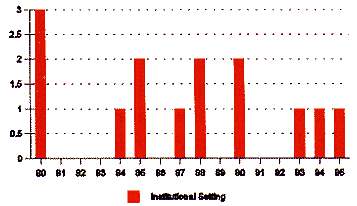
Figure 2.2 shows the deaths in custody for each jurisdiction over the last fifteen years. Deaths from police pursuit are also shown. There is a steady upward trend in New South Wales while South Australia has shown a sudden increase in the last year. In Western Australia a significant number of deaths have occurred from police car chases involving young people.
Figure 2.2 New South Wales |
Figure 2.2 Victoria |
Figure 2.2 Queensland |
Figure 2.2 Western Australia
|
Figure 2.2 South Australia |
Figure 2.2 Northern Territory
|
5. Custodial Authority
Table 2.5 presents the deaths in police custody, prisons and juvenile detention centres during and after the Royal Commission. Police pursuits are not included. The difference between the three forms of custody is statistically significant.7 As the Table demonstrates there has been a significant decline in the number and proportion of deaths in police custody (from 63 per cent to 23 per cent) and a corresponding increase in deaths in prisons (from 34 per cent to 76 per cent).
| Table 2.4 Custodial Authority | ||||
| Type |
RCIADIC |
Post-RCIADIC |
||
| Police |
62 |
63% |
18 |
23% |
| Prison |
33 |
34% |
60 |
76% |
| JDC |
3 |
3% |
1 |
1% |
| Total |
98 |
100% |
79 |
100% |
The possible causes behind the change in location of deaths is discussed at various points through the Report. The most probable cause is the speedier transfer of detainees from police cells to prison once they have been arrested.8 This commendable practice is evident when the time and location of death before and after the Royal Commission are compared. During the Royal Commission period there were no deaths during the first month of prison custody. However, as Table A1 in the appendix to this chapter shows, 18 per cent of deaths in custody occurred during the first month of prison custody.
Other causes include the slight decline in police arrests and a corresponding increase in imprisonment levels for both Indigenous and non-Indigenous people (see chapter 4). Safer custodial procedures in police lockups may also have contributed to the reduction in the numbers of deaths.
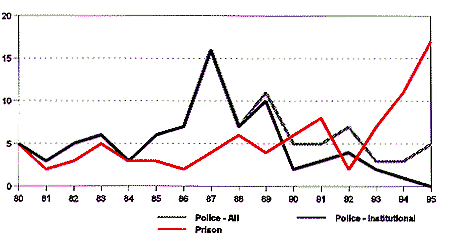
Figure 2.5 shows trends in deaths in custodial authority from 1980 to 1995. Police deaths in custody increased markedly in the late 1980s. They have subsequently shown a downward trend, particularly deaths in institutional settings.9 Deaths in prison showed a slightly upward trend in the 1980s but have significantly increased in the 1990s. In 1995 there were 17 Aboriginal deaths in prison.
Figure 2.5 Custodial Authority 1980-1995
6. Causes of Death
Tables 2.6a-c present the cause of death for each custodial authority.10 Self-inflicted injury and natural causes accounted for the majority of deaths in the two periods. Table 2.6 shows the causes of death in police custody for both institutional settings and police pursuit. There has been no significant change in the causes of death.11
It is important to note that the circumstances of death resulting from natural causes were not less necessarily less serious than deaths resulting from shooting by police officers or other injuries sustained during arrest. Indeed, as Part E shows the deaths where the most number of recommendations were breached were deaths resulting from natural cause and self-harm (see for example 62NSW, 67NSW, 43QLD, 45QLD and 65WA).
| Table 2.6a Causes of Deaths: Police Custody | ||||
|
Cause |
RCIADIC |
Post-RCIADIC
|
||
| Self-Inflicted |
23 |
37.1% |
6* |
33.3% |
| Natural |
20 |
32.3% |
7 |
38.9% |
| Drugs and Alcohol |
7 |
11.3% |
2 |
11.1% |
| Injury |
12 |
19.4% |
3 |
16.7% |
| Total - Institutional Settings |
62 |
100.00% |
18 |
100.0% |
| Police Pursuit - Car Chases |
0 |
11 |
||
| Police Pursuit - Gunshot/Other |
1 |
6 |
||
| Grand Total |
63 |
35 |
||
* Includes one case of self-infliction by drug overdose.
| Table 2.6b Causes of Deaths: Prison | ||||
| Cause |
RCIADIC |
Post-RCIADIC
|
||
| Self-Inflicted |
10 |
30.3% |
28 |
46.7% |
| Natural |
17 |
51.5% |
28 |
46.7% |
| Drugs and Alcohol |
2 |
6.1% |
1 |
1.7% |
| Injury |
4 |
12.1% |
3 |
5.0% |
| Total - Institutional Settings |
33 |
100.0% |
60 |
100.0% |
| Table 2.6c Causes of Deaths: Juvenile Detention Centres | ||||
| Cause |
RCIADIC |
Post-RCIADIC | ||
| Self-Inflicted |
1 |
33.3% |
- |
0.0% |
| Natural |
1 |
33.3% |
- |
0.0% |
| Drugs and Alcohol |
- |
0.0% |
- |
0.0% |
| Injury |
1 |
33.3% |
1 |
100.0% |
| Total - Institutional Settings |
3 |
100.0% |
1 |
100.0% |
Appendix
Table 2.8
|
Time Spent in Prison Custody
May 1989-December 1995 |
||||||||
| Time Spent |
Self-Inflicted |
Natural Causes |
Other |
Total |
||||
|
No |
% |
No |
% |
No |
% |
No |
% |
|
| 1 day & under 1 month |
8 |
31% |
2 |
8% |
- |
- |
10 |
18% |
| 1 & under 6 months |
12 |
46% |
10 |
38% |
- |
- |
22 |
40% |
| 6 & under 12 months |
3 |
12% |
5 |
19% |
- |
- |
8 |
15% |
| 1 & under 4 years |
2 |
8% |
8 |
31% |
2 |
67% |
12 |
22% |
| Over 4 years |
1 |
4% |
1 |
4% |
- |
- |
2 |
4% |
| Unknown |
- |
0% |
- |
0% |
1 |
33% |
1 |
2% |
| Total |
26 |
100% |
26 |
100% |
3 |
100% |
55 |
100% |
Endnotes
1. There were no deaths of Torres Strait Islander people in custody.
2.With regard to deaths in institutional settings during the Royal Commission period, the Australian Institute of Criminology reports an extra two Indigenous deaths not investigated by the Royal Commission (a death in prison in 1984 and a death in police custody in 1985) and have removed another death from their list (a death in prison in 1981). These differences between data sets are not significant.
3. Deaths resulting from police pursuits include eleven car chases, three police shootings, one drowning and one death from falling of a bridge. Institutional settings for the purpose of this report includes escapees from prison or police custody. This involves one case (12NT).
4. A chi-square test of significance was conducted on this table: x2 =0.09 (,df=1 p>0.05).
5. A two tailed t-test was conducted on the age distribution for each period: t=-0.62 (df=176, p>0.05). The distribution was not normalised.
6. The difference in the number of deaths in the jurisdictions during and after the Royal Commission was tested using a x2 analysis x2=17.1 (df=6, p<0.05).
8. For example, Department of Corrective Services in New South Wales now takes sentenced and remanded inmates into correctional facilities on the day rather than holding them in police cells overnight: Government of New South Wales, Implementation of Government Responses to the Recommendations of the Royal Commission into Aboriginal Deaths in Custody: New South Wales Government Report, Vol.1, 1993/94 , v1, p.33. See, for example, profile 67NSW.
9. However, by July 31 1996 there have been two deaths in police custody in institutional settings.
10. The categories are slightly different from that used by the Royal Commission. Self-inflicted deaths are grouped together and some of the other categories have been collapsed. See Royal Commission into Aboriginal Deaths in Custody, National Report, Volume 1, at p.53.
11. The difference between the causes of death in each period was tested separately for police and prisons,. The number of deaths in juvenile detention centres was too small and was thus excluded from the analysis. The results of the analysis for police were: x2 =0.05 (df=3, p>0.05). For prisons: x2 = 4.2 (df=3, p>0.05).
A Report prepared by the
Office of the Aboriginal and Torres Strait Islander Social Justice Commissioner
for the
Aboriginal and Torres Strait Islander Commission

