5 What do we know about employment discrimination and the labour force participation of people with disability?[6]
The Australian Human Rights Commission has a statutory responsibility to investigate and conciliate complaints of discrimination based on a person’s disability.
Each year, the Australian Human Rights Commission receives a significant number of disability discrimination complaints related to employment. In 2013-14, 830 complaints were received under the Disability Discrimination Act and 33% of these related to employment.[7]
Disability was reported by 4.2 million or 18.5% of Australians in 2012.[8] 2.2 million Australians with disability were aged 15-64.[9]
Labour force participation rates for people with disability in Australia are low. In 2012, the labour force participation rate for people with disability was 52.8%, compared with 82.5% for people without disability.[10] This figure has changed very little over the past 20 years. [11]
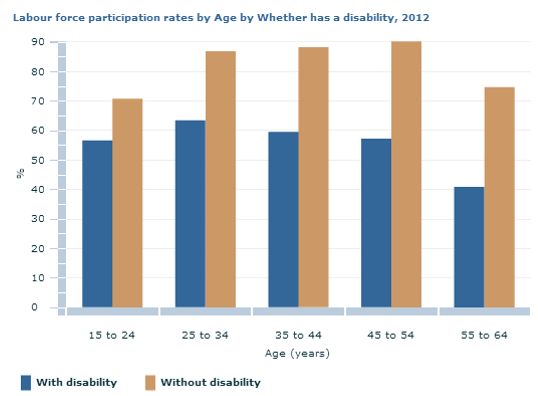
Figure 1: Labour force participation rates by age and whether has a disability, 2012
Figure 1 shows the differing labour force participation rates among people with disability and people without disability, across five age groups.
Age 15 to 24 years – For people with disability the labour force participation rate is 56.6%. For people without disability the labour force participation rate is 70.8%.
Age 25 to 34 – For people with disability the labour force participation rate is 63.4%. For people without disability the labour force participation rate is 86.9%.
Age 35 to 44 – For people with disability the labour force participation rate is 59.5%. For people without disability the labour force participation rate is 88.2%.
Age 45 to 54 – For people with disability the labour force participation rate is 57.2%. For people without disability the labour force participation rate is 90.2%.
Age 55 to 64 – For people with disability the labour force participation rate is 40.9%. For people without disability the labour force participation rate is 74.7%.
Source: Australian Bureau of Statistics, Survey of Disability, Ageing and Carers, 2012
The unemployment rate for people with disability in 2012 was 9.4%, nearly twice the rate of 4.9% for people without disability. [12]
Employment rates vary among people with disability. People with sensory or speech impairment have the highest labour force participation rate at 56.2%.[13] People with a physical restriction have the next highest labour force participation rate of 47.4%, while people with psychological disability have the lowest labour force participation rate at 29.1%.[14]
Employment rates in the public service are low. While people with disability comprise 8.8% of the broader Australian workforce, employment rates for people with disability are lower in the Australian Public Service (APS), with 3.1% of APS employees reporting disability.[15] However, 7.2% of respondents to the APS employee census identified as having some form of disability.[16]
- What other data or information is available on employment discrimination against Australians with disability?
5.1 How does Australia compare internationally?
There is a lack of reliable data on the labour force participation rates of people with disability internationally. However, we do know that Australia lags behind other OECD nations in terms of employment of people with disability. Research conducted in 2010 indicated that Australia was ranked 21st out of 29 OECD nations in terms of employment rates of people with disability.[17]
The National Inquiry will look at domestic and international best practice to address employment discrimination and other barriers that prevent or discourage participation of Australians with disability in the workforce.
Discussion question
- What lessons and leading practices can we learn from other countries to address employment discrimination and increase workforce participation of Australians with disability?
[6] The Australian Bureau of Statistics defines the labour force as people employed (including underemployed, full-time and part-time workers and self-employed people) and unemployed (including youth, long-term unemployed). A person who is not classified as either employed or unemployed is not in the labour force, Australian Bureau of Statistics, Disability, Ageing and Carers, Australia: Summary of Findings, 2012, Disability – Characteristics (2013). At
http://www.abs.gov.au/ausstats/abs@.nsf/Lookup/3A5561E876CDAC73CA257C210011AB9B?opendocument (viewed 8 May 2015)
[7] Australian Human Rights Commission, Annual Report 2013-2014, p 136 and p 145.
[8] Australian Bureau of Statistics, Disability, Ageing and Carers, Australia: Summary of Findings, 2012 (2013) Disability – Characteristics. At http://www.abs.gov.au/ausstats/abs@.nsf/Lookup/3A5561E876CDAC73CA257C210011AB9B?opendocument (viewed 8 May 2015).
[9] Australian Bureau of Statistics, Disability and Labour Force Participation, 2012 (2015). At http://www.abs.gov.au/ausstats/abs@.nsf/mf/4433.0.55.006 (viewed 6 May 2015).
[10] Australian Bureau of Statistics, Disability and Labour Force Participation, 2012 (2015). At http://www.abs.gov.au/ausstats/abs@.nsf/mf/4433.0.55.006 (viewed 6 May 2015).
[11] Labour force participation rates of people in disability were at 54.9% in 1993, compared with 52.8% in 2012. Australian Bureau of Statistics, Disability and Labour Force Participation, 2012 (2015). At http://www.abs.gov.au/ausstats/abs@.nsf/mf/4433.0.55.006 (viewed 6 May 2015).
[12] Australian Bureau of Statistics, Disability and Labour Force Participation, 2012 (2015). At http://www.abs.gov.au/ausstats/abs@.nsf/mf/4433.0.55.006 (viewed 6 May 2015).
[13] Australian Bureau of Statistics, Disability and Labour Force Participation, 2012 (2015). At http://www.abs.gov.au/ausstats/abs@.nsf/mf/4433.0.55.006 (viewed 6 May 2015).
[14] Australian Bureau of Statistics, Disability and Labour Force Participation, 2012 (2015). At http://www.abs.gov.au/ausstats/abs@.nsf/mf/4433.0.55.006 (viewed 6 May 2015).
[15] Table A5.6 Representation of employees reporting disability in the APS as at 30 June, 2010 to 2014. Employees reporting disability – ongoing and non-ongoing: N=4,971 %=3.1. Australian Public Service Commissioner, State of the Service Report 2013-2014 Appendix 5 – Diversity. At www.apsc.gov.au/about-the-apsc/parliamentary/state-of-the-service/state-of-the-service-2013-14/appendices/diversity (viewed 22 May 2015).
[16] Australian Public Service Commissioner State of the Service Report 2013-2014 Appendix 4 – Diversity. At http://www.apsc.gov.au/about-the-apsc/parliamentary/state-of-the-service/state-of-the-service-2013-14/appendices/diversity (viewed 11 May 2015). 68% of APS employees responded to the APS census survey. For the APS survey methodology see Australian Public Service Commissioner State of the Service Report 2013-2014 Appendix 3 – Survey methodologies. At http://www.apsc.gov.au/about-the-apsc/parliamentary/state-of-the-service/state-of-the-service-2013-14/appendices/survey-methodologies#footnote-a3-2 (viewed 1 June 2015).
[17] Organisation for Economic Co-operation and Development (OECD), Sickness, Disability and Work: Synthesis of findings (2010), p 51. At http://ec.europa.eu/health/mental_health/eu_compass/reports_studies/disability_synthesis_2010_en.pdf (viewed 13 May 2015).

